

The Star Schema: Key to Data Modelling in (power) BI
Table of Contents
This blog post will explain the Star Schema, its significance and how it simplifies data nalysis and how its applied to data warehouses, databases, data marts, and other tools.[1]
Introducing Star Schema
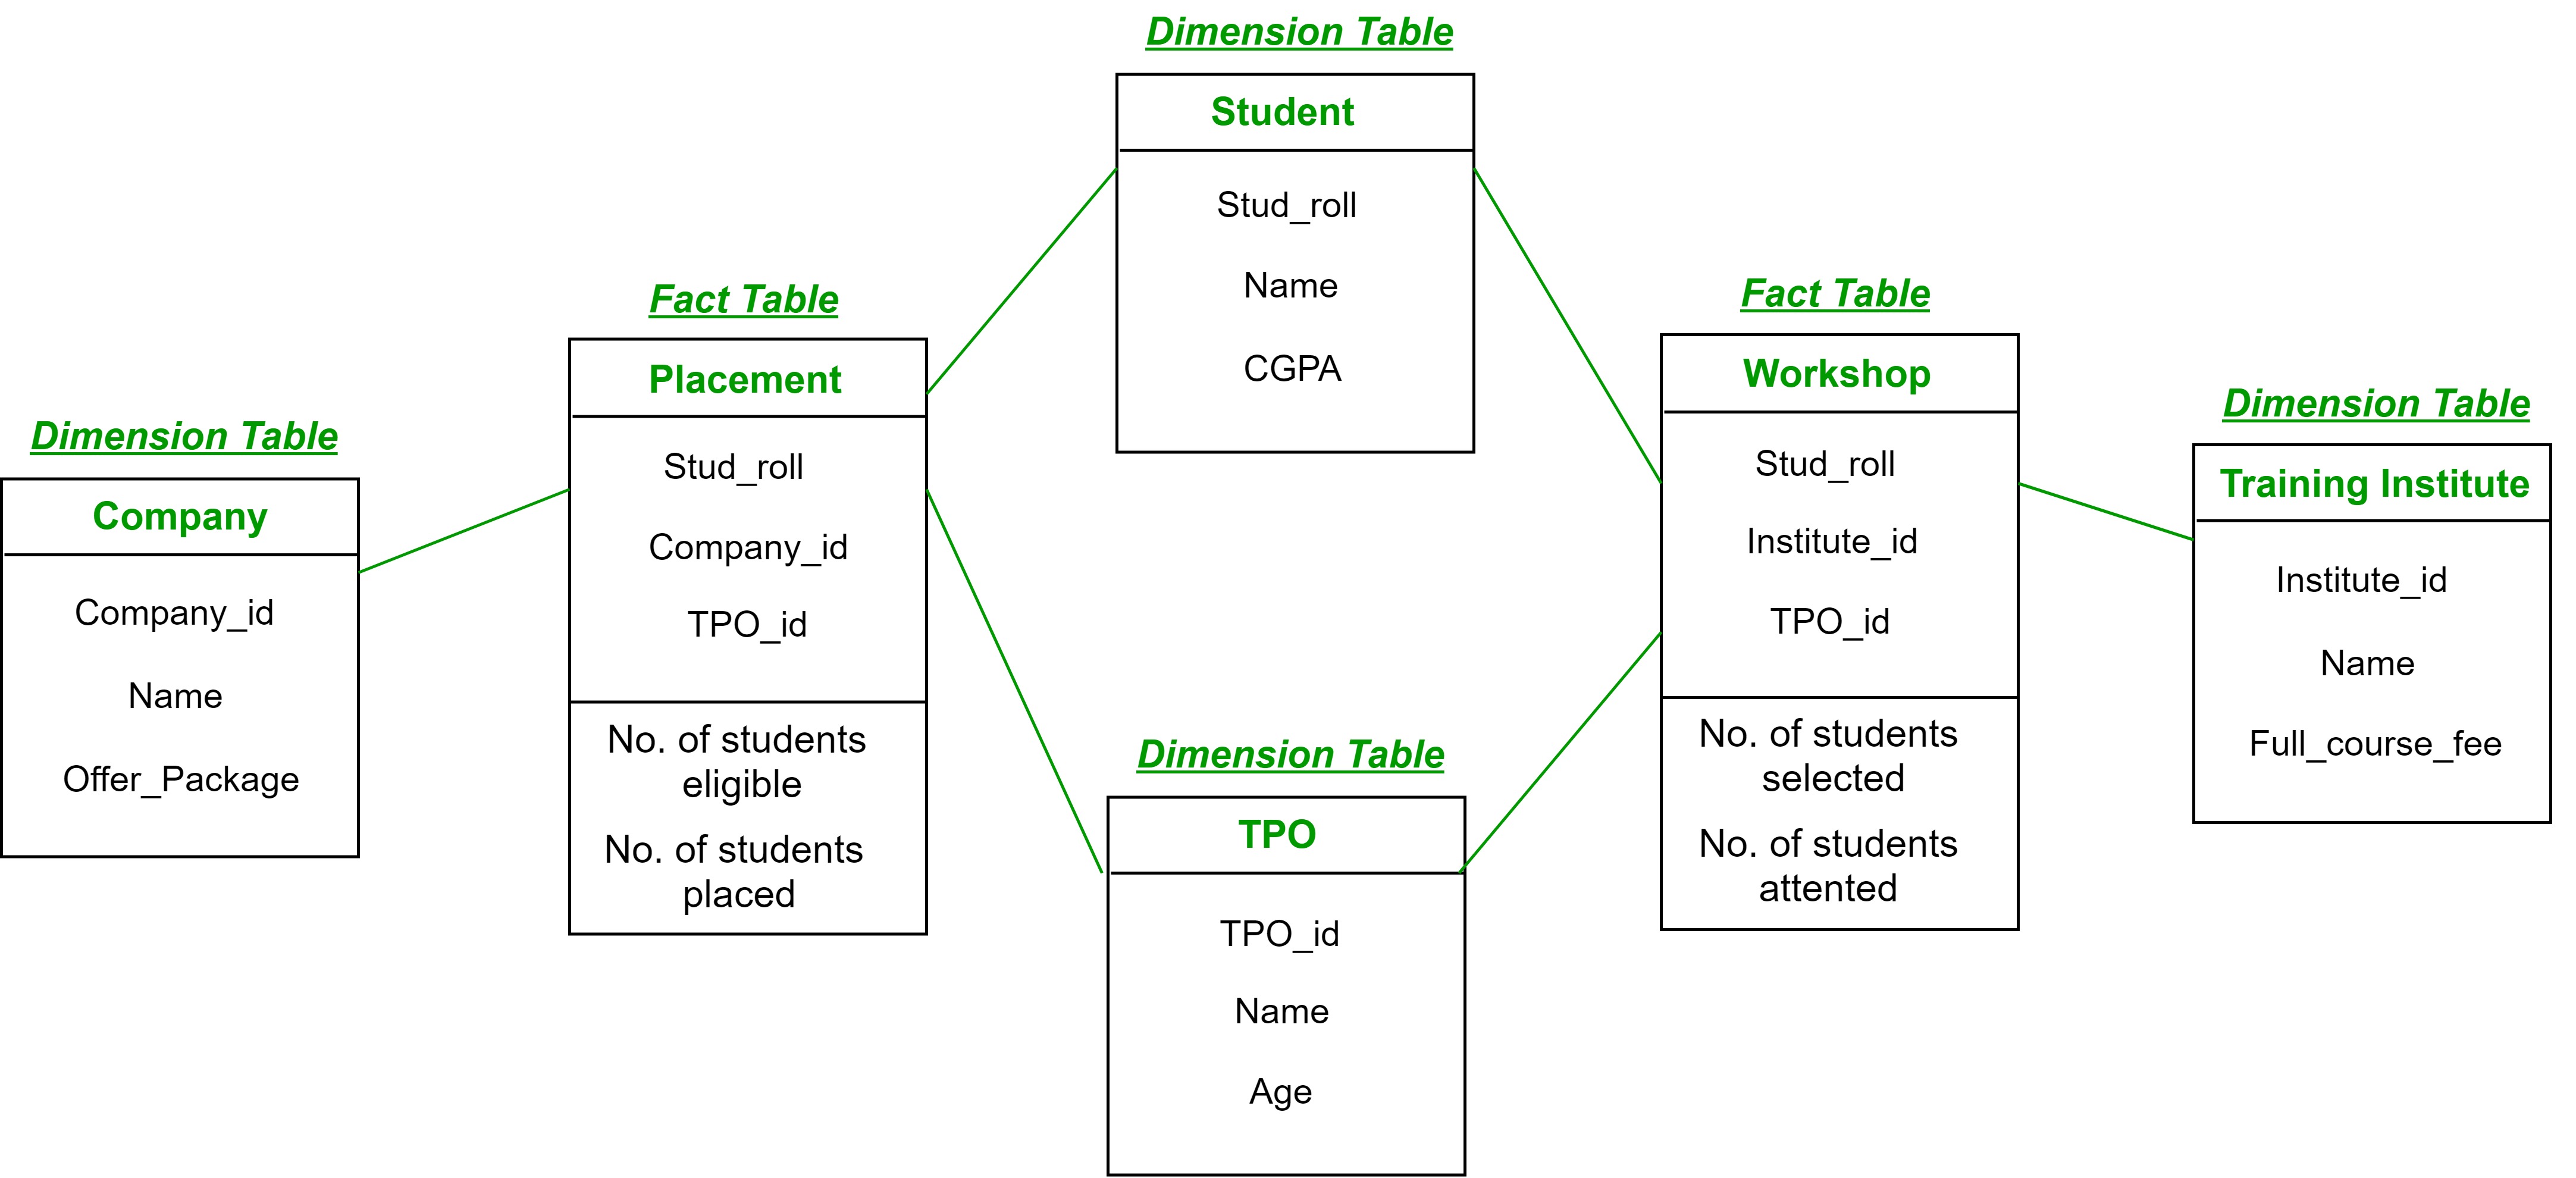
The Star Schema is an established data modelling technique adopted for relational data warehouses to streamline the extraction of data, a crucial feature for analytical and reporting functions. Its name derives from the star-like pattern formed in the entity-relationship diagram (ERD), where a central fact table is linked to multiple dimension tables radiating from it.[3]Its design is particularly conducive to Business Intelligence applications such as Power BI, making it a popular choice in contemporary data architecture for its efficiency in querying and reporting.
Computational Power
The Information Revolution, which started in the mid-1980s, has brought about a significant shift from manual to digital information storage and processing. This shift has primarily been driven by the rise of information-based jobs, the affordability of computing power, and the advent of the Internet.
The technological transformation has dramatically influenced the way organisations function and how people interact with each other. As a result, businesses are now automating several routine tasks and services, such as inventory management, payroll, and banking transactions. Online Transaction Processing (OLTP) databases, specifically designed to handle a high volume of short transactions, are utilised to support these services.
Online Transaction Processing
Imagine OLTP databases as bustling post offices, where each postbox represents a table row and contains various messages or records. To efficiently sort and organise these messages, the post office uses categories or columns, arranging them by postcode, recipient, or size. This system makes data retrieval easy. Oracle, IBM DB2, and Microsoft SQL Server are well-known for their OLTP capabilities.
Normalised Data
OLTP systems are relational databases that have undergone normalisation to allow for efficient cross-referencing and data linking between different tables. As a result, they are ideal for handling a large number of user transactions, especially in real-time scenarios. OLTP systems are excellent at handling simple queries and updates.[6]
Structured Query Language
OLTP databases use SQL (Structured Query Language) to interact with and manage this data. SQL uses queries (set of commands) to instruct the computer where to find, add, or change data within that database.
Data Analysis Needs
As businesses grew, there was an increasing need to analyse the vast amounts of transactional data OLTP systems collected. Although OLTP (Online Transaction Processing)[7]databases efficiently handle real-time, transactional data, they are structured primarily for operational tasks. Considering complex analysis, OLTP's operational focus limits its ability to conduct extensive data analytics.
OLAP Systems
OLAP systems were designed to facilitate data analysis. They are optimised for query and reporting and are particularly suitable for handling complex analytical calculations and multidimensional data analysis. Unlike OLTP systems, OLAP systems can quickly execute analytical and ad hoc queries.
OLAP databases can be built using relational and non-relational models. They often use multidimensional databases (like cubes in SQL Server Analysis Services) or relational databases designed in a star or snowflake schema to facilitate complex queries and aggregations. OLAP systems can utilise relational and non-relational (including multidimensional) data models, depending on the specific technology and requirements.
Data Warehouses
Data warehousing is a concept that emerged alongside OLAP systems. It was created to fulfill the requirements of OLAP systems for comprehensive data analysis. Data warehouses are centralised repositories that aggregate data from various sources, including OLTP databases. This aggregated data is important for the multidimensional analysis capabilities of OLAP.
To store the data in a format optimised for analysis and querying, the data often undergoes processing and transformation through ETL (Extract, Transform, Load). This structure enables organisations to analyse data comprehensively, generate reports, and derive insights from extensive datasets.
While OLAP and OLTP share some similarities, the two have fundamental differences. The table below highlights the differences in usage, database type, nature of queries, speed, modification, storage, and backup frequency. It is important to note that while these are general characteristics, specific implementations may vary based on technology and architecture.
The table below shows the key differences between OLAP and OLTP regarding usage, database type, nature of queries, speed, modification, storage and backup frequency. It is important to note that while these are general characteristics, specific implementations may vary based on technology and architecture.
| OLAP vs OLTP Databases | ||
|---|---|---|
| OLAP - Online Analytical Processing | OLTP - Online Transaction Processing | |
| Usage | Business Warehouse | Fast Transactions, e.g., ATMs |
| Type | Multidimensional Database | Relational Database |
| Queries | Complex queries involving Time intelligence (current and past data) | Simple queries involving few records |
| Speed | Generally slower, but quick processing is not a requirement | Fast, as required for transactional processing |
| Edits | Data rarely gets modified | Frequent due to its transactional nature |
| Workload | Primarily read-oriented | Both reading and writing data |
| Storage | Large data sets that require substantial storage | Relatively modest storage requirements |
| Backups | Backups are less frequent due to read-oriented use and infrequent data modifications | Backups are frequent, and concurrent backups are necessary due to high transaction volumes and data sensitivity |
Role of the Star Schema
Moving from the specific OLAP and OLTP systems functions, how does the Star Schema fit in? Well, the Star Schema solves the problem of the complex data held in OLTP. It simplifies the data model, making it useable for analytical querying. [8] It achieves this by separating transactional data, held in fact tables, from descriptive data stored in dimension tables. This makes the data more suitable for querying and analysing for business intelligence purposes.
The Star schema consists of a central fact table. What is a fact table?
- A fact table contains data typically at the most detailed level, often called the "granular" or "transactional" level. (measures like sales, revenue)
- A fact table usually has one or more date or time-related columns used for analysis.
- A fact table allows for data aggregation based on numerical values. (sales amount, profit, units sold, etc.)
- A fact table contains detailed records at the transactional level.
- A fact table is on the "many" sides of a one-to-many relationship with dimension tables. (see next paragraph)
Dimension Tables
Multiple dimension tables surround the fact table. Dimension Tables in a Star Schema provide context and detailed categorisation for the data within the Fact Table. [1]
- The dimension tables provide context (descriptive, textual, or categorical data) and detail for data in the fact table.
- The dimension tables might include attributes like time (dates, weeks, months) or customer details (ID, name, address).
- The dimension tables are linked to the fact table through foreign keys or unique identifiers.
- The dimension table facilitates more intuitive and efficient querying for comprehensive data analysis.
- The dimension table is on the "one" side of a one-to-many relationship with the fact table.
Dimensionality
The dimension tables embody the concept of Dimensionality. [10] Dimensionality reflects the various perspectives from which data can be analysed. It defines the different angles or dimensions (such as time, geography, or product categories) from which you can slice and dice data.
- Dimensionality refers to the number and complexity of attributes in the dimension tables.
- Dimensionality defines the different perspectives or dimensions (like time, geography, or product categories) for analysing data.
- Higher Dimensionality can provide more angles for analysis but may complicate the data model and query execution.
Granularity
Granularity primarily describes the level of detail or depth of data in tables, especially data warehouse fact tables. It indicates the depth or fineness of the data stored in these tables. For example, sales data could be recorded at the level of individual transactions (high granularity) or as daily summaries (lower granularity).
Granularity can also apply to dimension tables, as it influences their attributes' details. For instance, in a time dimension table, granularity can range from years, months, and days to hours or minutes. The chosen level of granularity directly impacts the precision and potential insights that can be derived from the data.
- High granularity allows for more detailed analysis but increases storage needs and can slow down query performance.
- Low granularity offers quicker query performance and reduced storage needs but limits the depth of analysis.
Understanding both concepts helps design a data model that balances detail, storage, and performance to meet specific business analysis needs.
Conclusion
The Star Schema data model is a business intelligence and analytics solution. It addresses the limitations inherent to relational databases. The Star Schema presents a concise, easily navigable representation of complex data structures.
This schema presents data in an easily understandable format, enhancing query performance while reducing errors through transparent data relationships.
Compared to conventional relational models, the Star Schema is more efficient in handling large volumes of data. As data architectures continue to evolve and confront new challenges, the adaptability of the Star Schema is likely to maintain its relevance. It could be integrated with emerging technologies like AI and machine learning. It can transform data analysis and business intelligence strategies if that happens.
Diagramming Tools
These tools offer a range of functionalities and support you in database diagramming. Some focus on simplicity and educational use, while others provide more robust features for professional and enterprise environments.
| Tool Name | URL | Summary and Pricing |
|---|---|---|
| Diagrams.net | app.diagrams.net | Free charges for Atlassian add-ons. |
| dbdiagram | dbdiagram.io | Free for 10 diagrams, then $9/month. |
|
ERD Plus |
Completely free, designed for educational purposes. |
|
|
Lucidchart |
Free for 3 documents, then $7.95-$9/month. |
|
|
QuickDBD |
Free for 1 diagram, Pro plan at $14/month. |
|
|
MySQL Workbench Community Edition |
Free for MySQL Community Edition. |
|
|
SqlDBM |
Free trial plans start at $25/month. |
|
|
dbForge Studio for SQL Server |
ERD tool for Microsoft SQL Server, pricing not specified. |
|
|
Visual Paradigm's Database Design Tool |
ERD tool for various DBMS, pricing not specified. |
|
|
DeZign for Databases |
Database modelling tool, pricing not specified. |
|
|
Dataedo |
Database documentation tool with ERD, pricing not specified. |
|
|
Cacoo |
Free for up to 6 sheets, then $5/user/month. |
|
|
DrawSQL |
Free for one user, public diagrams, 15 tables/diagrams, from $15 for more. |
|
|
Miro |
Free for unlimited team members, 3 boards, then $8/user/month. |
|
|
Gliffy |
Free for Confluence and Jira apps for 10 users, online app free for students for 4 years, then from $8/user/month. |
|
|
Creately |
||
| dbdiagram | dbdiagram.io | Free for 10 diagrams, then $9/month. |
-
Fitz Insights, "Understanding the Star Schema in Business Intelligence." Link to article ↩
-
Oxford Reference, "Data Analytics." Link to article ↩
-
Microsoft Azure, "Online Analytical Processing (OLAP)." Link to article ↩
-
IBM, "What is OLTP?" Link to article ↩
-
SetScholars, "Comprehensive Comparison of OLTP and OLAP: Key Differences, Use Cases, and Choosing the Right Solution." Link to article ↩
-
LearnVern, "What is a Relational Database Management System? - MySQL Tutorial." Link to article ↩
-
Microsoft, "Power BI Guidance: Star Schema." Link to article ↩
-
IBM, "Dimension Tables and Entities." Link to article ↩
-
IBM, "Step: Identify Grain." Link to article ↩